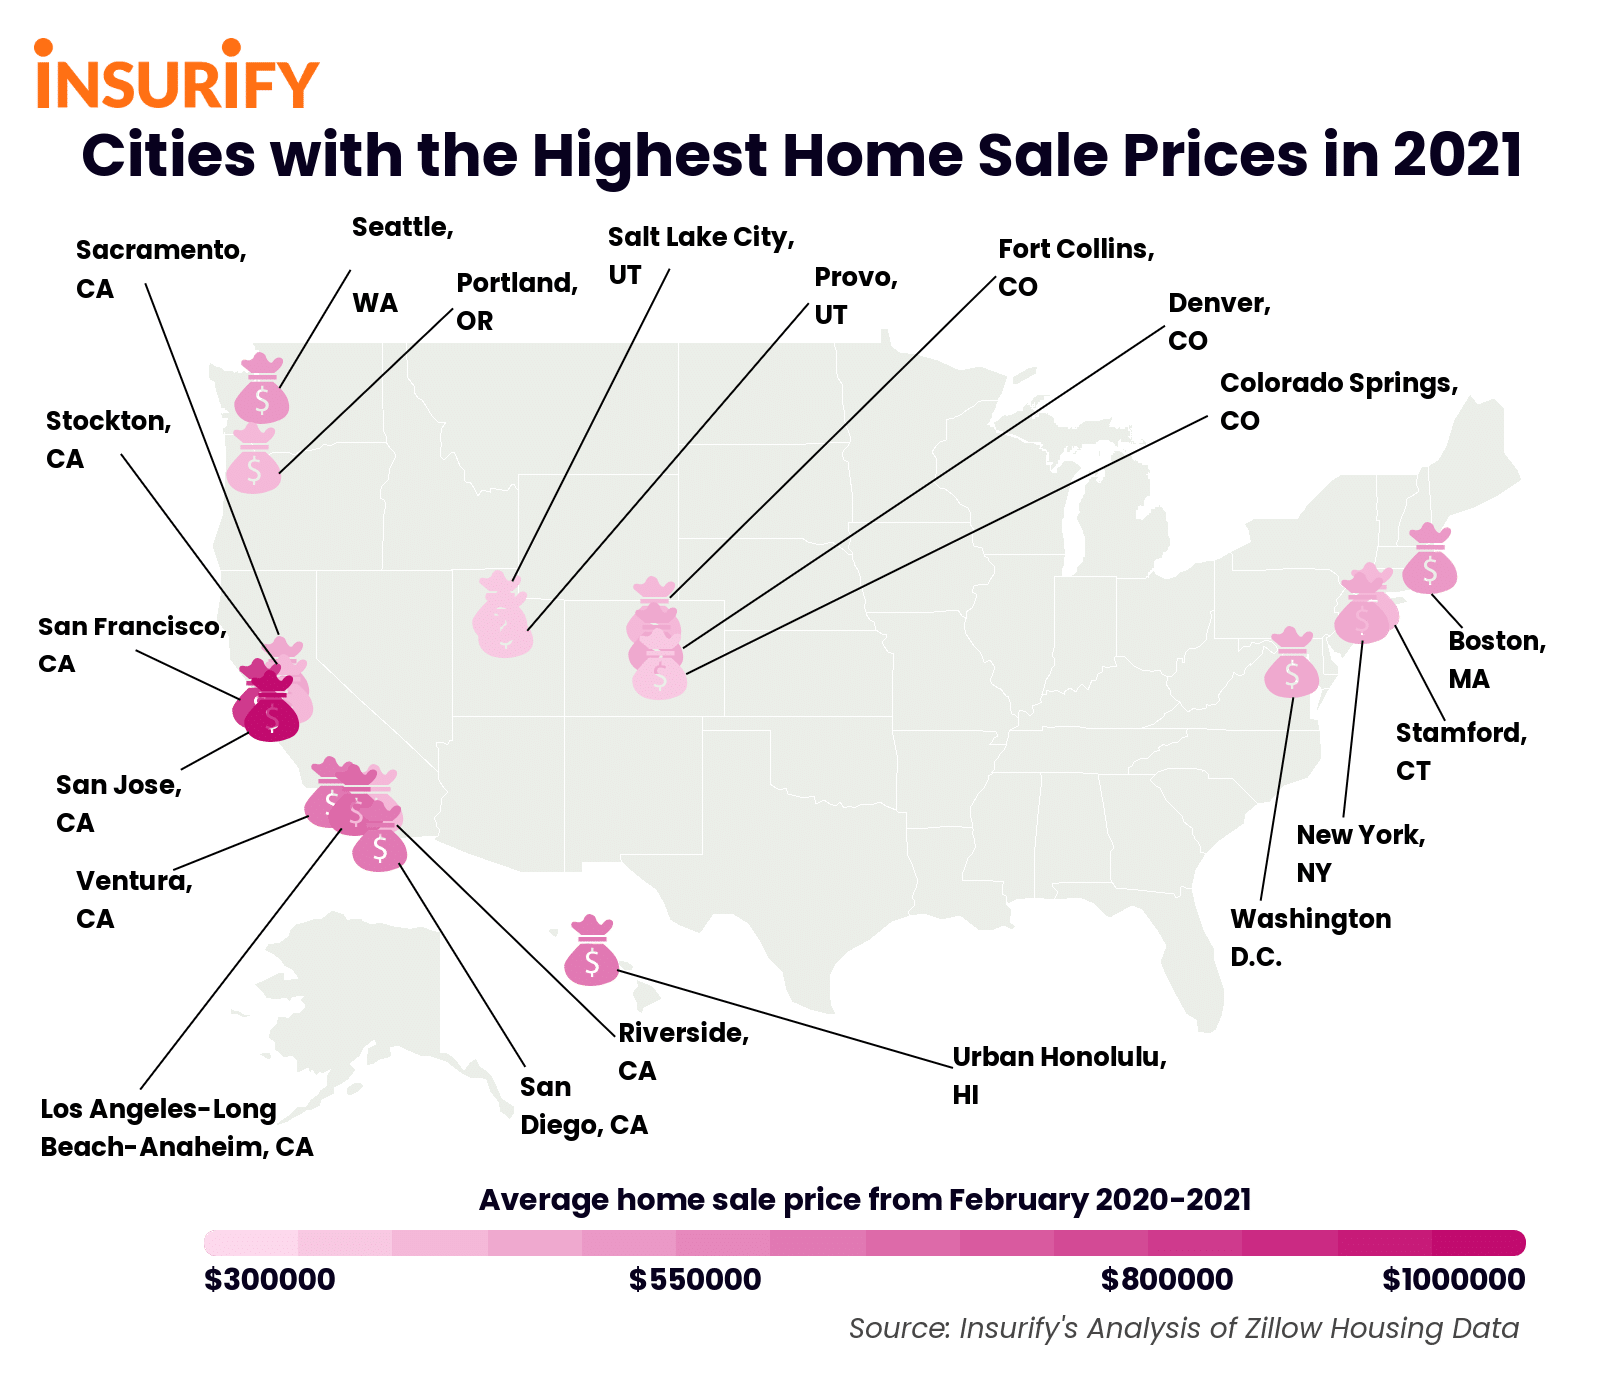
The Price is Right!? Cities with the Highest Home Sale Prices in 2021
In one of the most competitive years in real estate in recent history, houses in these cities are the biggest-ticket properties in the nation.
It’s been a landmark year for the American housing market. Real estate is selling at astonishing rates, making this past year one of the most competitive periods in which to buy a house to date. Insurify’s analysis on cities with the hottest real estate markets in 2021 revealed that the average number of days a home remained on the market before being sold had decreased by 11 percent between 2020 and 2021. This increased competition means that it’s a seller’s market, and potential buyers have to shell out more in order to get what they want.
The average price of a home sold in the United States has risen over the past decade. Since 2011, the median home sale price has increased by 66 percent, from $176,317 in February 2011 to $294,069 in February 2021. Home values are bound to rise over time naturally, save for economic recessions or market crashes. However, even after a major nationwide financial blowout — or in 2020’s case, a global pandemic — home values can bounce back and return to their upward trend due to lower mortgage rates and strong demand.
There’s no question that homes are a hot commodity across the nation. But in certain cities, they’re not just a tough get, but they also come at a remarkably steep price. To see where houses have the highest price tags, the researchers at Insurify looked to national housing market data and identified the cities with the highest home sale prices in 2021.
Insights
- National averages. The average home sale price between February 2020 and February 2021 was $264,300 across the 97 most populous metropolitan areas in the United States. The average list price during this time was $301,389. On average, cities in America experienced a year-over-year increase in home sale prices from 2019-2020 to 2020-2021 at 5.43 percent. The average citywide median household income is $59,311.14 for all U.S. metropolitan areas. However, the average median household income for the 97 cities included in the analysis is higher, at $65,958.36.
- Expensive real estate in the Golden State. Eight of the twenty cities with the highest home sale prices over the past year are located in California. In fact, the top five cities on the list all hail from the Golden State. This may come as no surprise given that California has the second-highest home sale prices in the nation, where homes sell for $554,670 on average (second only to Hawaii’s average home sale price of $594,482).
- Household income and home sale prices are significantly correlated. It may be little wonder that the cities with the highest home values in the nation are also home to more affluent residents. The median household income in all twenty of the cities with the highest home sale prices is between 15 and 55 percent higher than the national average. Insurify’s data scientists ran a regression to determine the relationship between income and home sale prices and found a significant, positive correlation between the two (R=0.77, p < 0.05). This finding suggests that the higher a city’s median household income, the more expensive their homes on the market will be.
Methodology
The data scientists at Insurify, a site to compare home insurance quotes, analyzed real estate data from Zillow to identify the cities with the highest home sale prices over the past year. Zillow reports monthly on the median sale prices of homes on the market across U.S. metropolitan areas. Insurify’s analysts took the average median sale prices across the most populous 97 metropolitan areas in the nation from February 2020 through February 2021 and determined the twenty cities whose real estate sold for the highest prices. Median list prices were also retrieved from Zillow’s public data. Median household income estimates by U.S. metropolitan area are from the U.S. Census Bureau.

Where in California is the highest average home price?
In 2021, San Jose has the highest average home price, not only in California but in the nation, at $1,060,398. San Francisco, Los Angeles, Ventura, San Diego, Sacramento, Stockton, and Riverside also have some of the highest home prices in the nation.
Cities with the Highest Home Sale Prices in 2021
20. Provo, UT
- Average home sale price: $336,248
- Average list price: $392,633
- Increase in average sale prices 2020-2021: +8.37%
- Median household income: $79,152
19. Colorado Springs, CO
- Average home sale price: $340,730
- Average list price: $466,539
- Increase in average sale prices 2020-2021: +9.33%
- Median household income: $72,633
18. Salt Lake City, UT
- Average home sale price: $349,199
- Average list price: $483,586
- Increase in average sale prices 2020-2021: +9.89%
- Median household income: $80,196
17. Riverside, CA
- Average home sale price: $385,590
- Average list price: $418,166
- Increase in average sale prices 2020-2021: +4.67%
- Median household income: $70,954
16. Fort Collins, CO
- Average home sale price: $398,808
- Average list price: $435,631
- Increase in average sale prices 2020-2021: +2.86%
- Median household income: $75,186
15. Portland, OR
- Average home sale price: $407,895
- Average list price: $468,489
- Increase in average sale prices 2020-2021: +4.13%
- Median household income: $78,439
14. Stamford, CT
- Average home sale price: $409,081
- Average list price: $721,471
- Increase in average sale prices 2020-2021: +3.56%
- Median household income: $97,053
13. Stockton, CA
- Average home sale price: $420,885
- Average list price: $407,970
- Increase in average sale prices 2020-2021: +4.84%
- Median household income: $68,997
12. Washington D.C.
- Average home sale price: $427,052
- Average list price: $488,330
- Increase in average sale prices 2020-2021: +3.83%
- Median household income: $105,659
11. New York, NY
- Average home sale price: $429,288
- Average list price: $579,667
- Increase in average sale prices 2020-2021: +3.30%
- Median household income: $83,160
10. Denver, CO
- Average home sale price: $433,268
- Average list price: $526,633
- Increase in average sale prices 2020-2021: +4.40%
- Median household income: $85,641
9. Sacramento, CA
- Average home sale price: $434,483
- Average list price: $520,967
- Increase in average sale prices 2020-2021: +6.60%
- Median household income: $76,706
8. Boston, MA
- Average home sale price: $476,910
- Average list price: $582,300
- Increase in average sale prices 2020-2021: +6.22%
- Median household income: $94,430
7. Seattle, WA
- Average home sale price: $512,046
- Average list price: $651,648
- Increase in average sale prices 2020-2021: +6.70%
- Median household income: $94,027
6. Urban Honolulu, HI
- Average home sale price: $594,482
- Average list price: $627,377
- Increase in average sale prices 2020-2021: +3.05%
- Median household income: $87,470
5. San Diego, CA
- Average home sale price: $599,161
- Average list price: $754,553
- Increase in average sale prices 2020-2021: +3.38%
- Median household income: $83,985
4. Ventura, CA
- Average home sale price: $609,916
- Average list price: $796,633
- Increase in average sale prices 2020-2021: +3.80%
- Median household income: $92,236
3. Los Angeles-Long Beach-Anaheim, CA
- Average home sale price: $674,395
- Average list price: $864,998
- Increase in average sale prices 2020-2021: +5.49%
- Median household income: $77,774
2. San Francisco, CA
- Average home sale price: $811,787
- Average list price: $872,296
- Increase in average sale prices 2020-2021: +2.31%
- Median household income: $114,696
1. San Jose, CA
- Average home sale price: $1,060,398
- Average list price: $1,102,666
- Increase in average sale prices 2020-2021: +1.85%
- Median household income: $130,865
If you have any questions or comments about this article or would like to request the data, please contact insights@insurify.com.
More From WRRV-WRRB